How To Scrape For The 2025 Price Comparison Vrbo And Airbnb To Find The Best Deal?
Introduction
The vacation rental landscape continues to evolve rapidly as we move through 2025, with Airbnb and Vrbo maintaining their positions as industry leaders. Understanding the nuanced Price Comparison Vrbo And Airbnb factors has never been more important for travelers looking to maximize value. Both platforms offer unique advantages, but which delivers better pricing in today's market?
Our comprehensive analysis dives deep into the current pricing structures, utilizing extensive Vacation Rental Data Scraping methods to provide accurate, up-to-date information. Whether planning a weekend getaway or a month-long sabbatical, this guide will help you navigate the complex world of vacation rental pricing to find the best deals for your needs.
Understanding the Platforms
Before exploring the pricing details, it’s essential to first grasp the unique positioning of each platform in 2025:
Airbnb
Airbnb has significantly evolved its offerings beyond traditional short-term rentals. In 2025, the platform features an extensive selection, including curated experiences, premium listings under Airbnb Luxe, and flexible options like extended monthly stays.
With a user community surpassing 350 million and around 7.5 million active listings globally, Airbnb continues to dominate with its diverse accommodation model.
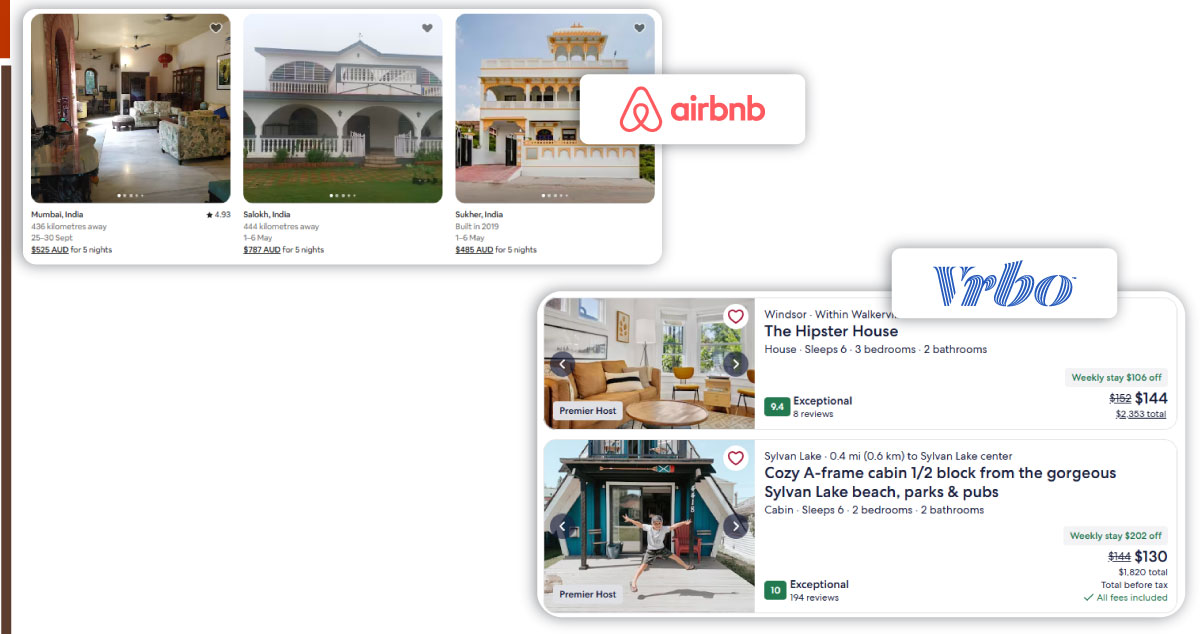
Vrbo
Vrbo, formerly known as HomeAway, maintains a clear focus on full-home vacation rentals. It caters primarily to families and groups seeking entire property bookings, offering around 2.5 million listings worldwide. This specialization has helped Vrbo maintain a stronghold in its niche, distinguishing it from broader platforms.
Each utilizes its proprietary Vacation Rental Listing Dataset , which plays a key role in shaping the variety of properties and pricing dynamics observed on the platform. Having a solid understanding of these core differences is vital as we move into a closer look at pricing trends and comparisons.
Methodology of Our Analysis
We adopted a data-driven approach using advanced scraping methodologies to ensure a precise and meaningful Price Comparison Vrbo And Airbnb. We aimed to create a fair, like-for-like comparison across both platforms by collecting and analyzing extensive vacation rental pricing data from 50 of the most sought-after travel destinations globally
Here’s how we approached it:
- Collected data from over 10,000 listings on each platform
- Standardized results by factoring in property size, amenities, and location
- Evaluated pricing trends across varying seasons and booking lead times
- Calculated total costs by including all platform-specific fees and applicable taxes
We ensured consistency in our comparisons by leveraging powerful tools to Extract Airbnb Listing Data and applying similar rigor to gather Vrbo information. Our methodology for Web Scraping Vrbo vs Airbnb listings allowed us to align comparable properties, enabling a more accurate and insightful evaluation of pricing structures across both platforms.
The 2025 Price Comparison Vrbo And Airbnb Breakdown
Our in-depth Airbnb vs Vrbo Cost Analysis for 2025 uncovered some surprising pricing patterns that travelers and hosts should know. The simplified table below presents a snapshot of the significant differences between these two popular vacation rental platforms:
| Factor | Airbnb | Vrbo | Best Value |
|---|---|---|---|
| Average nightly rate | $157 | $189 | Airbnb |
| Service fees | 14.2% | 9.5% | Vrbo |
| Cleaning fees | $92 average | $115 average | Airbnb |
| Long-stay discounts | Up to 50% | Up to 30% | Airbnb |
| Last-minute bookings | Variable pricing | Fixed pricing | Depends on timing |
| Rural properties | Higher prices | More competitive | Vrbo |
| Urban properties | More competitive | Higher prices | Airbnb |
| Luxury properties | Premium pricing | Better value | Vrbo |
While this table offers a quick comparison, it’s important to note that pricing dynamics can vary widely depending on location, property type, booking season, and host strategy. In the following sections, we’ll explore these elements further to clarify how each platform performs in different scenarios.
Fee Structures Explained
A clear understanding of fee structures is crucial when conducting a Price Comparison Vrbo And Airbnb. Our evaluation of the Airbnb Vacation Rentals Dataset reveals that although Airbnb listings may initially seem more affordable, the overall cost can increase significantly due to added fees:
1. Airbnb Fees in 2025
Airbnb applies a guest-focused fee model that varies based on stay duration and host preferences.
- Service fee: Ranges from 14–16% for guests, with lower rates often available for monthly stays.
- Cleaning fee: Determined by individual hosts, with an average cost of around $92.
- Additional guest fees: Frequently applied for parties exceeding the standard occupancy limit.
- Security deposits: Optional and typically range between $100 and $500.
2. Vrbo Fees in 2025
Vrbo employs a slightly different approach. It generally has lower service fees but other costs that can add up depending on the property size and duration of stay.
- Service fee: Generally lower, between 6–12% for guests.
- Cleaning fee: Host-defined, averaging around $115.
- Booking fee: A flat rate based on the total value of the reservation.
- Security deposits: These are more commonly required than on Airbnb, especially for high-value bookings.
Our analysis of the Vrbo Vacation Rentals Dataset indicates that although Vrbo typically charges lower service fees, its cleaning fees can be higher—particularly for larger or luxury properties.
Property Types and Their Cost Differentials
Through in-depth analysis powered by Vacation Rental Data Scraping, we uncovered notable pricing differences across various property categories on Airbnb and Vrbo:
Apartments and Condos:
- Airbnb listings for urban apartments are priced approximately 12% lower on average, making it a more affordable option for city travelers.
- Vrbo, however, delivers around 8% better value for resort condos, appealing to vacationers seeking comfort and scenic locations.
Single-Family Homes:
- For larger homes with 4+ bedrooms, Vrbo consistently shows 7–15% lower pricing, aligning with its focus on family and group travel.
- Airbnb stands out in the smaller home segment, offering 5–10% more competitive rates for properties with 1–3 bedrooms.
Unique Properties:
- Airbnb leads in this niche with a broader selection of unique stays, such as treehouses, yurts, and cabins, and more aggressive pricing.
- While Vrbo features fewer such listings, the platform maintains slightly lower average prices for its unique properties.
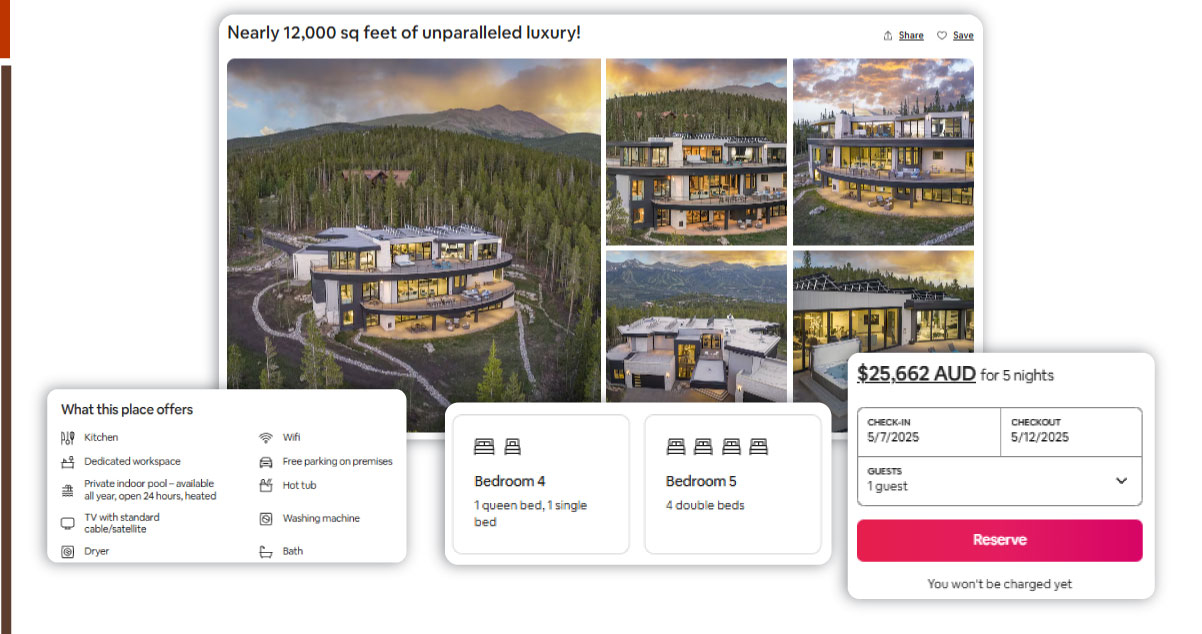
Luxury Properties:
- Vrbo’s upscale listings reflect an average of 8% lower total costs when compared to similar Airbnb Luxe accommodations.
- On the other hand, Airbnb tends to include more premium amenities for the price, catering to travelers seeking high-end experiences.
These pricing patterns emphasize how each platform strategically caters to different market segments. Vrbo’s strengths lie in larger, family-friendly homes and value-driven luxury options, while Airbnb’s diverse inventory favors smaller units, distinctive experiences, and urban affordability.
Location-Based Price Variations
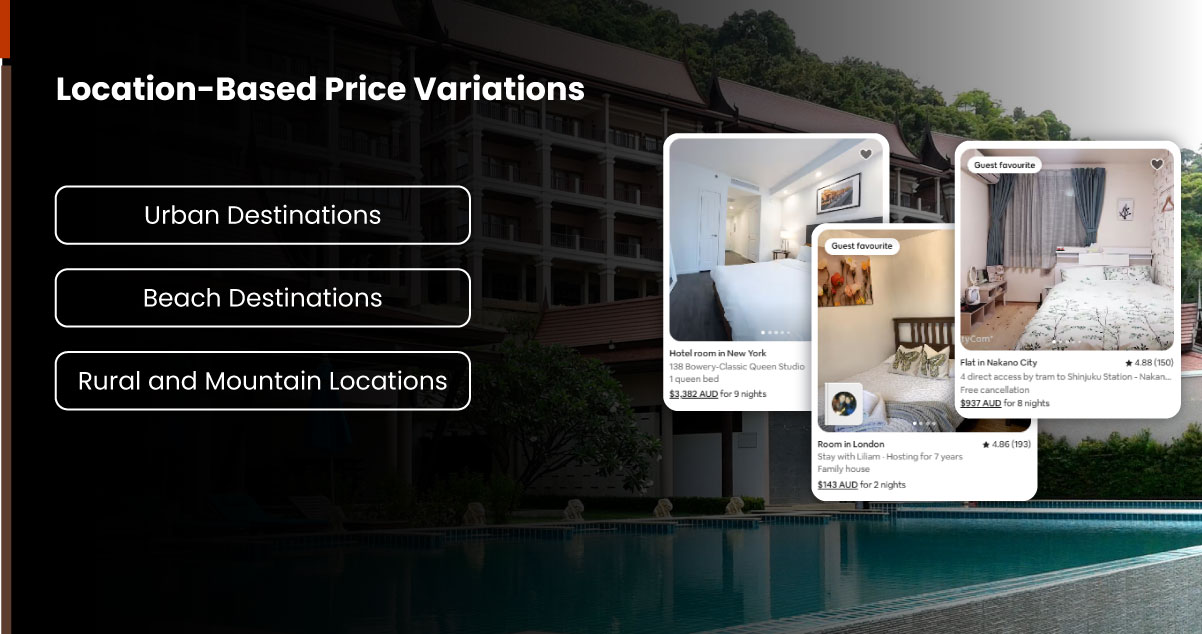
When choosing between platforms, location significantly impacts which one delivers better value. Based on our Web Scraping Vrbo vs Airbnb data, clear trends emerge across various destination types:
1. Urban Destinations
Urban Destinations refer to major metropolitan areas and global cities characterized by dense populations, modern infrastructure, and high tourist traffic.
- New York: On average, Airbnb prices come in about 15% lower than Vrbo, making it the preferred choice for budget-conscious travelers.
- London: Similarly, Airbnb is 12% cheaper on average, offering more competitive rates for city stays.
- Tokyo: A surprising shift—Vrbo offers surprising value, with rates approximately 9% less than Airbnb, especially for group accommodations.
2. Beach Destinations
Beach Destinations include coastal regions and seaside towns popular for vacations, relaxation, and resort-style accommodations.
- Miami: For sunseekers, Vrbo is 7% more affordable when booking beachfront properties, especially luxury condos and family rentals.
- Cancun: Airbnb offers 10% better pricing, particularly for short-term stays near the tourist hubs.
- Greek Islands: For spacious stays, Vrbo provides 13% better value for villa rentals, especially in less commercialized areas.
3. Rural and Mountain Locations
Rural and Mountain Locations are remote or countryside areas, often sought for nature escapes, adventure travel, or peaceful retreats.
- Colorado mountain towns: Adventure travelers will find that Vrbo averages 18% lower prices, especially for larger cabins and lodges.
- Tuscan countryside: Airbnb is 8% more economical, making it ideal for solo travelers or couples seeking cozy farm stays.
- Australian Outback: With fewer listings available, Airbnb offers 23% better value due to limited Vrbo inventory, particularly for remote stays.
These patterns reinforce the importance of comparing both platforms when booking your 2025 travels. As the data reveals, neither platform consistently offers better pricing across all destinations, and the best value often depends on where you’re heading.
Hidden Costs to Watch For
When comparing vacation rental platforms, it is essential to look beyond the base rates and advertised fees. Our Travel Data Intelligence reveals a range of hidden charges that can significantly affect your total booking cost.
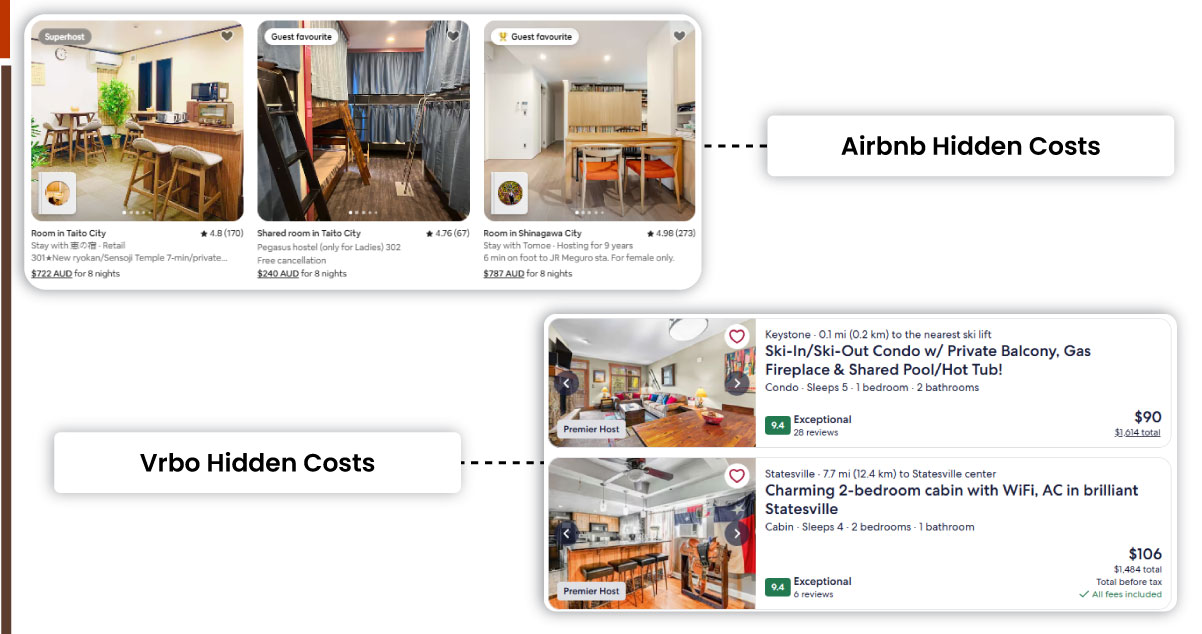
1. Airbnb Hidden Costs
These are unexpected or variable fees added during the booking process that can make a property appear cheaper than it is.
Common examples include:
- Dynamic pricing surges based on demand (up to 40% increases)
- Weekend rate premiums averaging 24% higher than weekday stays
- Pet fees averaging $75 per stay (charged by 57% of pet-friendly listings)
- Additional services like early check-in or late checkout ($25–$50)
2. Vrbo Hidden Costs
The base listing price does not reflect these supplementary charges, often tied to protection policies or property-specific amenities.
Common examples include:
- Higher damage protection fees (optional but often encouraged)
- Booking protection insurance averaging $99 per reservation
- Higher cancellation penalties the closer it gets to check-in
- Property-specific fees like pool heating, parking, or resort access
When performing an Airbnb vs Vrbo Cost Analysis, these hidden costs can completely shift the pricing landscape. A listing that appears 10% cheaper on Airbnb may become more expensive once weekend surcharges and service fees are added.
How Travel Scrape Can Help You?
We excel at guiding travelers through the intricate landscape of vacation rental pricing with cutting-edge Vacation Rental Data Scraping technologies. Our tailored services include:
- Personalized Price Comparison Reports: We create customized reports that compare Vrbo and Airbnb options, specifically designed to match your travel preferences, dates, and needs.
- Price Tracking and Alerts: Our robust systems track both platforms in real-time and send alerts when prices decrease for your selected destinations and travel dates.
- Historical Pricing Analysis: With access to our comprehensive Airbnb and Vrbo Vacation Rentals Dataset, we provide valuable insights into historical pricing trends, helping you pinpoint the ideal time to book.
- Fee Calculator: Our proprietary tool meticulously breaks down all applicable fees and hidden charges, offering a transparent view of the total cost of your stay on both platforms.
- Custom Data Solutions: We offer Custom Travel Data Solutions for travel agencies and frequent travelers, providing continuous, tailored insights into vacation rental markets worldwide.
By tapping into our expertise in Travel Data Intelligence and vacation rental analytics, we empower you to navigate the complexities of vacation rental pricing and uncover real savings for your 2025 travel plans.
Conclusion
In our detailed Price Comparison Vrbo And Airbnb analysis, we've found that neither platform consistently offers the best pricing. The ideal choice depends on your travel needs, destination, property type, and travel dates.
For 2025 travelers, we recommend comparing both platforms before booking, especially considering the total price, including all fees. Opt for Vrbo if you're planning a family vacation with larger homes and more extended stays, and consider Airbnb for urban getaways, unique accommodations, and off-season travel.
While Travel Aggregators give you a broad overview, they often miss the intricate pricing insights our in-depth analysis uncovers. Need help finding the best deals across both platforms? Contact Travel Scrape for expert support in optimizing your 2025 travel plans. Our team specializes in Travel Industry Web Scraping to uncover hidden deals and savings that general searches may overlook.